
Use your analytics in other tools
Put any chart from your dashboards into Google Sheets, Excel, Looker Studio, Power BI or Grafana, and keep its numbers up to date there.
Make a data link
A data link is a private address that returns one chart's numbers. You make it once, paste it into the other tool, and the tool fetches fresh numbers whenever it refreshes.
- Open the chart on its dashboard in Dashboard. If the chart doesn't exist yet, build it first. See Dashboards.
- Open the chart's
...menu and pick Use in another tool. - Click Make data link, then copy the link you need: the CSV one for a spreadsheet, the JSON one for a BI tool.
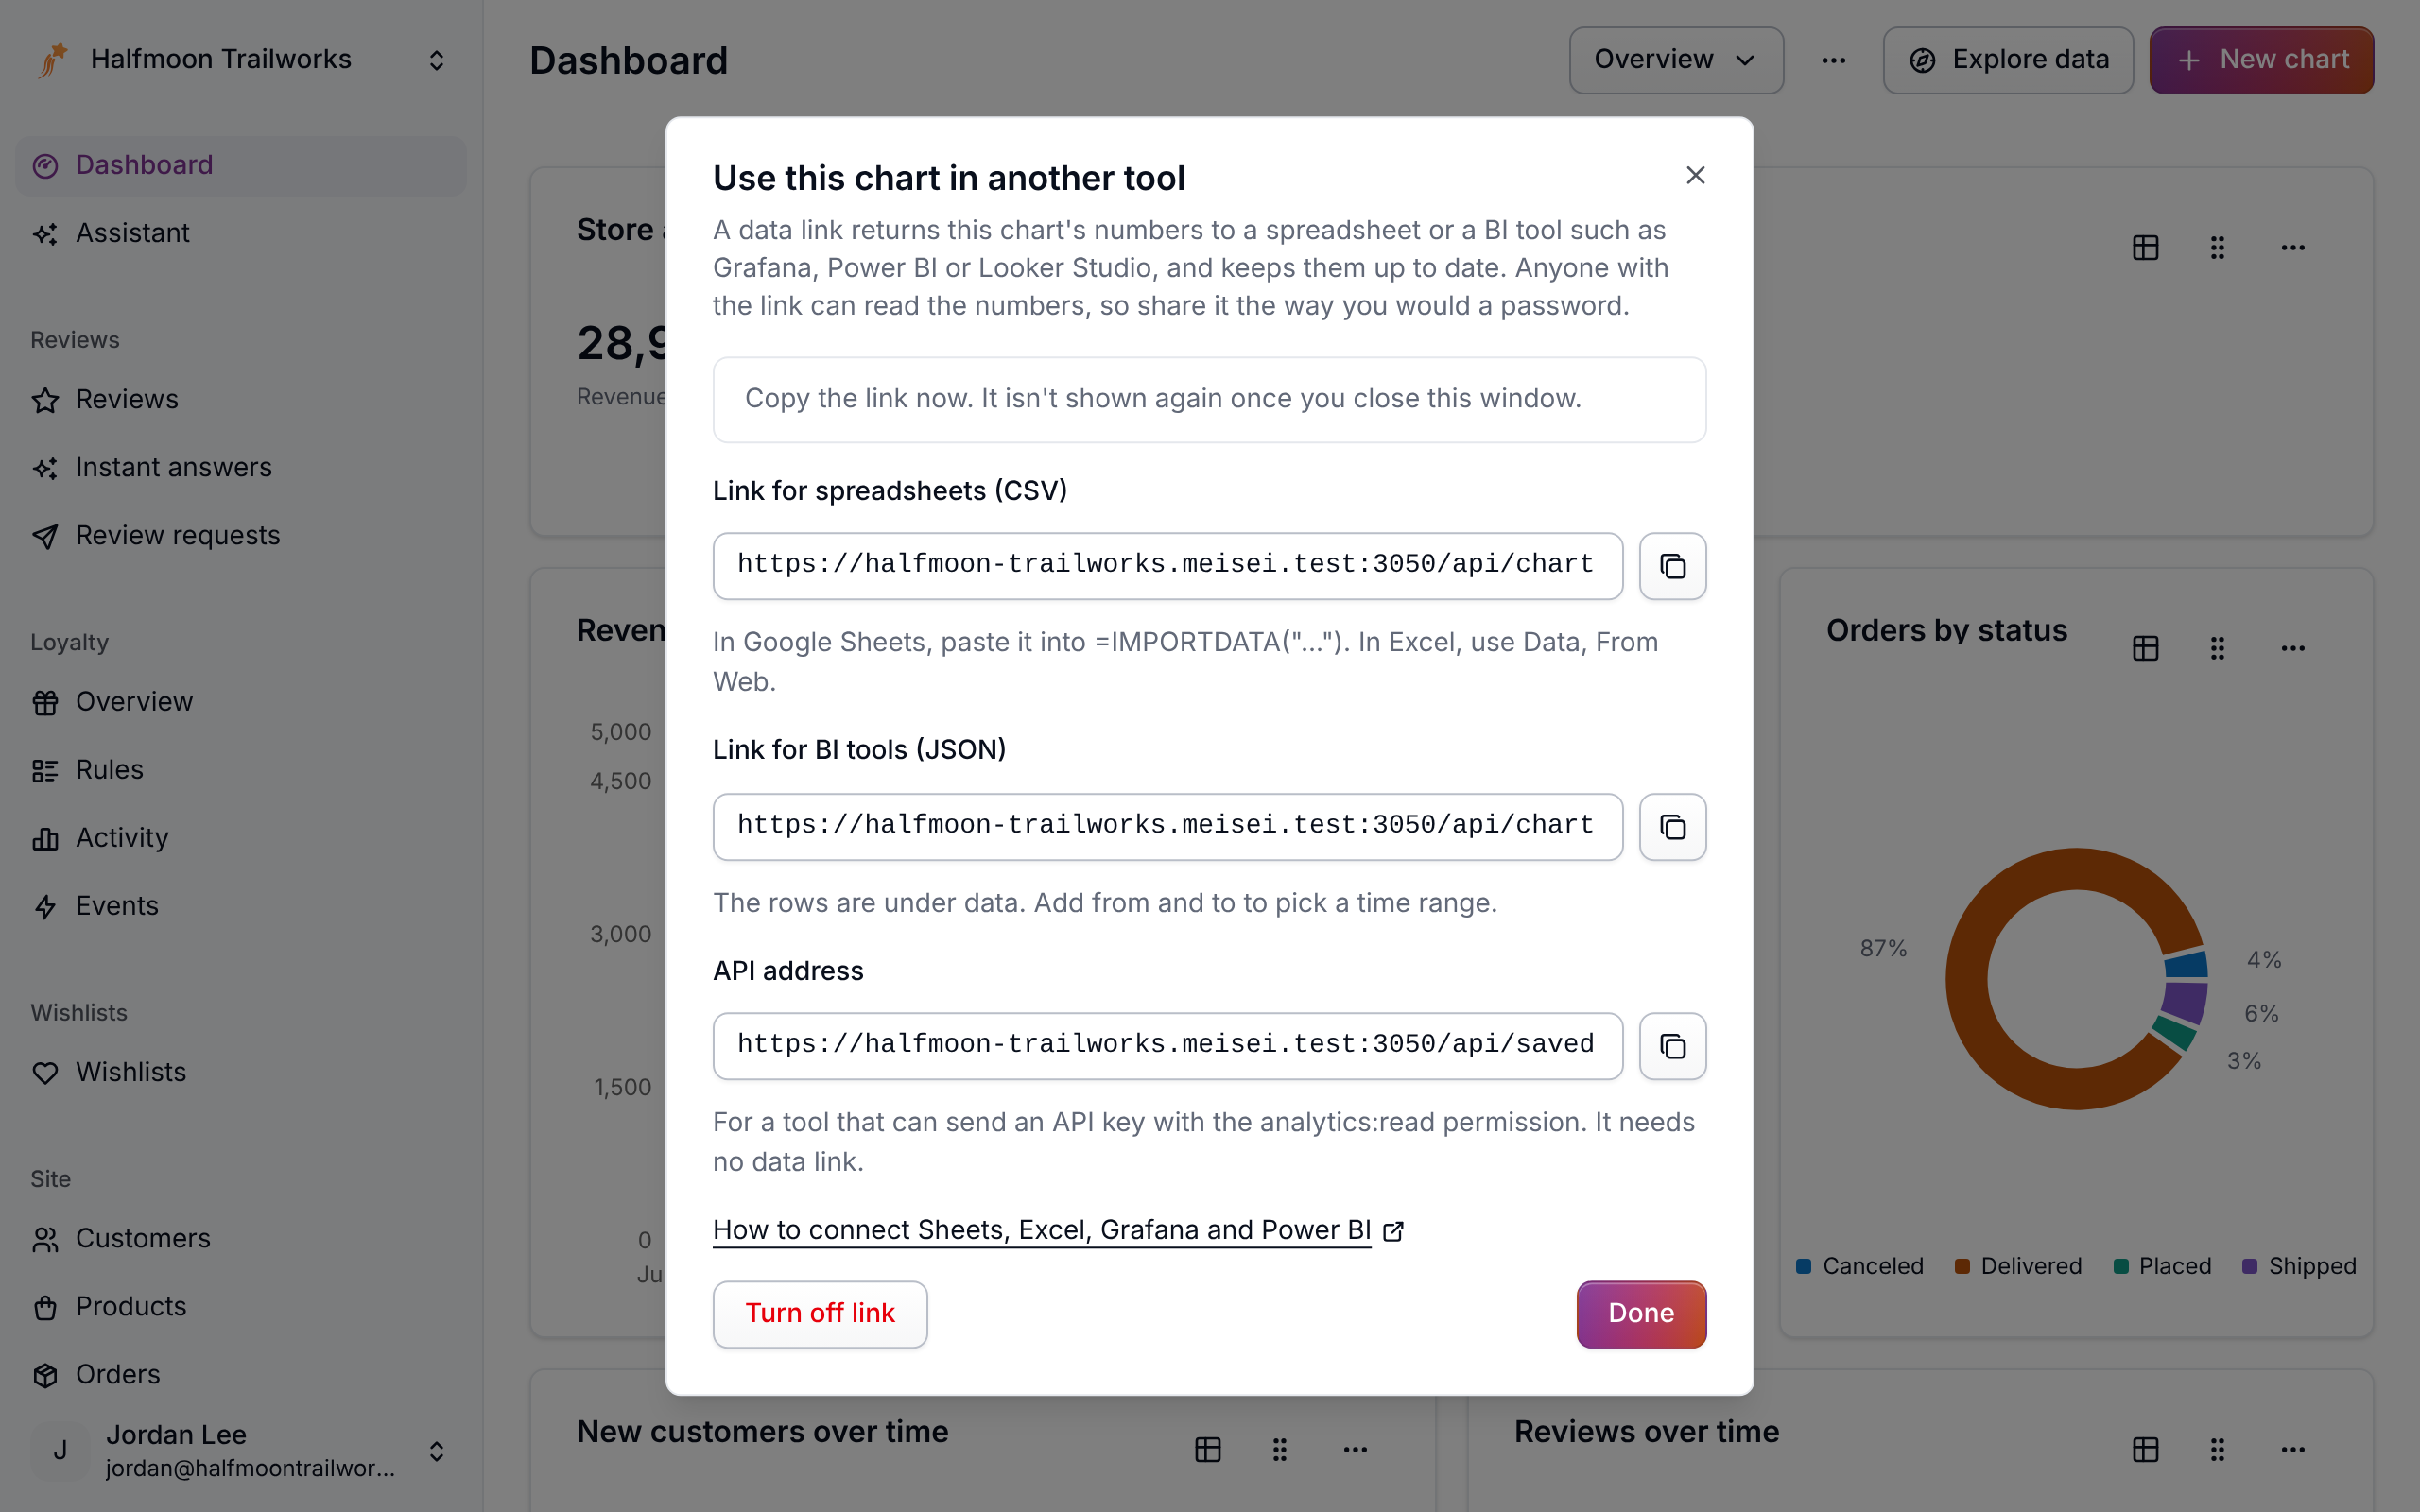
The link is only shown once. If you lose it, make a new one from the same menu, which also turns the old one off.
Anyone who has the link can read that chart's numbers, and nothing else in your store. Share it the way you would a password, and turn it off from the same window when you no longer need it.
Connect your tool
- Google Sheets. In any cell, type
=IMPORTDATA("your CSV link"). Sheets refreshes it about once an hour. - Excel. Go to Data → From Web, paste the CSV link, and load it. Use Refresh All to update it.
- Looker Studio. Import the chart into a Google Sheet as above, then add that sheet as a data source.
- Power BI. Choose Get data → Web, paste the CSV link, and load it. Set a scheduled refresh in the Power BI service.
- Grafana. Add an Infinity data source, make a panel with the JSON link as the URL, and
set the root selector to
data.
Pick a time range
A data link returns what the chart shows. To cover a different period, add from and to to
the end of the link, as dates and times. For example, to see May 2025 only, add
&from=2025-05-01T00:00:00Z&to=2025-06-01T00:00:00Z after ?format=csv (or start with ?
on the JSON link). In Grafana, use its time picker values in those two places, and every
panel follows the dashboard's time range.
To change what the chart measures or how it's grouped, edit the chart. The link keeps working and picks up the change.
How fresh the numbers are
Meisei keeps each answer for up to a minute, so a tool that refreshes very often sees numbers at most a minute old. Most tools refresh far less often than that.
For developers
A tool that can send an API key can read the same numbers without a data link, and can ask
its own questions too. See Analytics and
Saved charts in the API reference. A key needs the analytics:read
permission.
If something isn't working
- The link says it doesn't exist. It was turned off or replaced. Make a new one from the chart's menu.
- The tool shows "Other" as a value. The chart groups its smallest values together. Edit the chart to remove that grouping, or add a filter so fewer values are left.
- The tool says there are too many requests. Something is refreshing very often from one place. Slow the refresh down to once a minute or less.
Next steps
- Dashboards to build the charts you'll share.
- Filtering to narrow a chart to what matters.
- Rate limits if you're building on the API.